Introduction
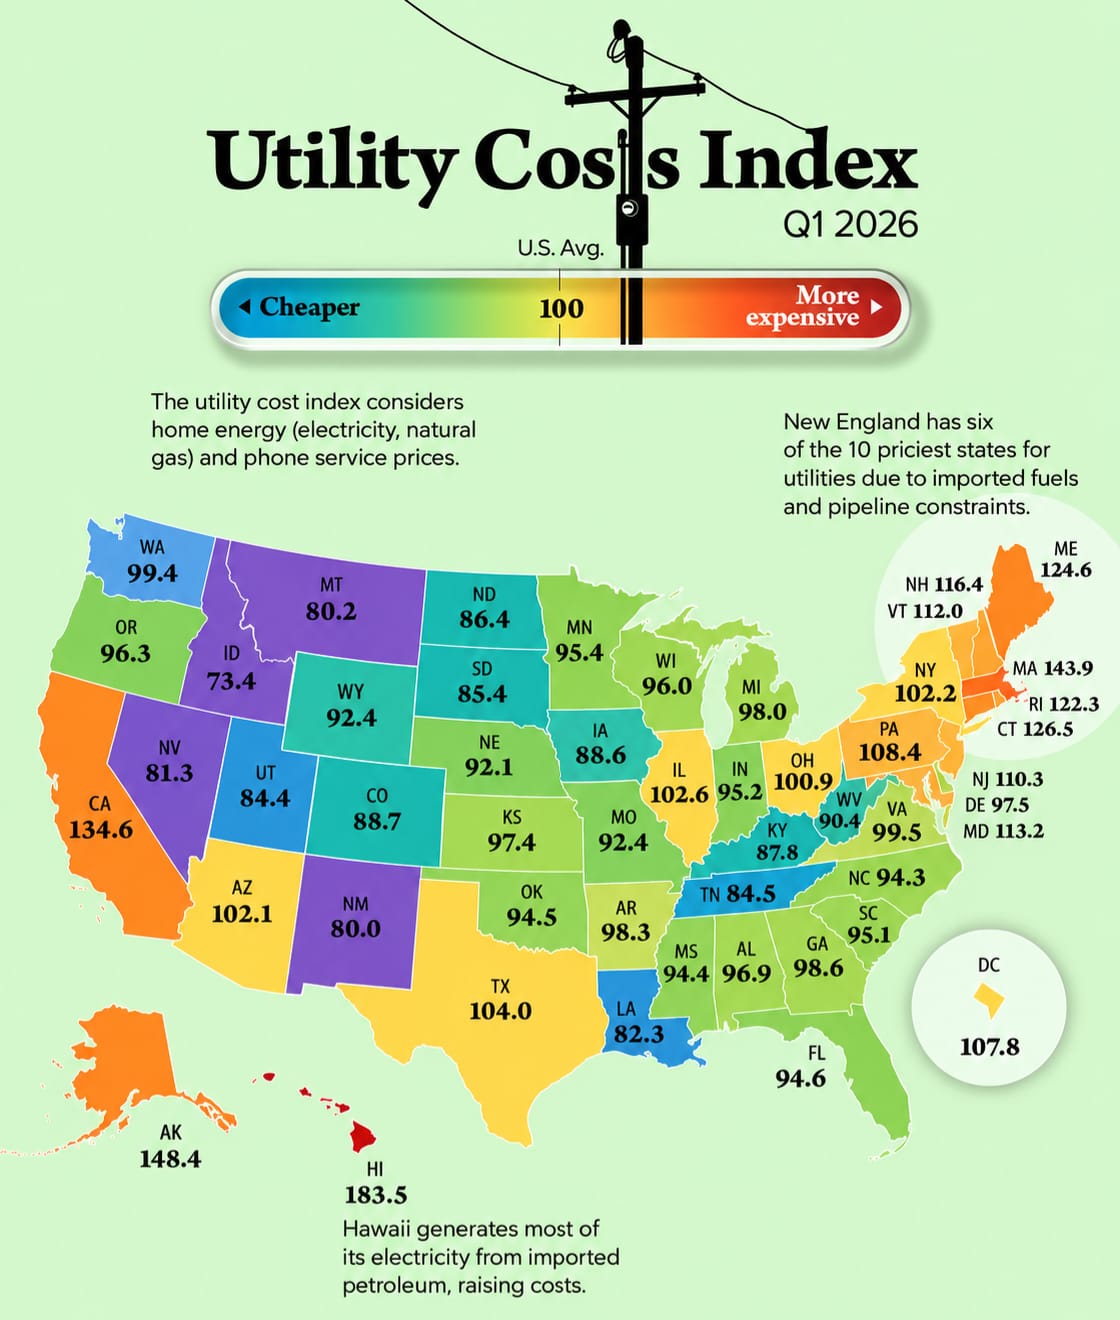
Utility bills can make a noticeable difference to the cost of living, especially in states where electricity, natural gas, and phone services are expensive. The latest utility costs by state comparison shows a surprisingly wide gap between the cheapest and most expensive states in America.
The Q1 2026 Utility Cost Index uses 100 as the U.S. average. A score below 100 means utility costs are lower than the national average, while a score above 100 means they are higher. The index covers home energy costs, including electricity and natural gas, as well as phone service.
The data comes from the C2ER Cost of Living Index through the Missouri Economic Research and Information Center (MERIC).
Hawaii Has the Highest Utility Costs
Hawaii has the highest utility cost index in the country, with a score of 183.5.
That means Hawaii’s utility costs are 83.5% above the national average. The state’s reliance on imported petroleum for electricity is one reason energy costs remain particularly high.
Alaska ranks second at 148.4, followed by Massachusetts at 143.9 and California at 134.6.
This puts four states well above the national benchmark.
Top 10 States With the Highest Utility Costs
| Rank | State | Utility Cost Index |
|---|---|---|
| 1 | Hawaii | 183.5 |
| 2 | Alaska | 148.4 |
| 3 | Massachusetts | 143.9 |
| 4 | California | 134.6 |
| 5 | Connecticut | 126.5 |
| 6 | Maine | 124.6 |
| 7 | Rhode Island | 122.3 |
| 8 | New Hampshire | 116.4 |
| 9 | Maryland | 113.2 |
| 10 | Vermont | 112.0 |
The complete Q1 2026 data places all six New England states in the top 10.
New England Stands Out
New England has an unusually high concentration of states with expensive utilities.
Massachusetts has an index of 143.9, while Connecticut is at 126.5. Maine follows at 124.6, Rhode Island at 122.3, New Hampshire at 116.4, and Vermont at 112.0.
According to the analysis accompanying the map, limited natural-gas pipeline capacity can make the region more dependent on imported liquefied natural gas and heating oil during periods of high demand.
California Is Among the Most Expensive
California’s utility cost index is 134.6, placing it fourth nationally.
The figure is 34.6% above the U.S. average.
California therefore combines relatively high utility costs with the broader cost pressures associated with one of the country’s largest economies.
Which States Have the Cheapest Utilities?
Idaho has the lowest utility cost index in the Q1 2026 comparison.
Its score of 73.4 puts it 26.6% below the national average.
New Mexico follows at 80.0, while Montana records 80.2 and Nevada reaches 81.3.
10 States With the Lowest Utility Costs
| Rank | State | Utility Cost Index |
|---|---|---|
| 1 | Idaho | 73.4 |
| 2 | New Mexico | 80.0 |
| 3 | Montana | 80.2 |
| 4 | Nevada | 81.3 |
| 5 | Louisiana | 82.3 |
| 6 | Utah | 84.4 |
| 7 | Tennessee | 84.5 |
| 8 | North Dakota | 86.4 |
| 9 | South Dakota | 85.4 |
| 10 | Kentucky | 87.8 |
Idaho’s low utility costs are partly associated with its access to relatively inexpensive electricity sources, particularly hydropower.
Utility Costs in Texas, New York and Florida
Some of America’s biggest states sit close to the national average.
Texas has a utility index of 104.0, meaning its utilities are about 4% above the national benchmark.
New York scores 102.2, while Illinois records 102.6.
Florida is lower, with an index of 94.6.
These numbers show why utility costs can tell a different story from a state’s overall cost of living. A state can have relatively affordable housing while still having above-average utility expenses.
Why Do Utility Costs Differ Between States?
Utility prices are affected by several factors.
Energy sources
The type of energy a state uses can have a major effect on prices. States with access to relatively inexpensive electricity sources can have lower utility costs.
Fuel transportation
Geography also matters. Remote states may have higher costs when fuel has to be transported over long distances.
Natural gas infrastructure
Pipeline capacity can influence the availability and price of natural gas, particularly during periods of extreme weather.
Weather
Hot summers and cold winters can increase household energy use because residents rely more heavily on air conditioning and heating.
Local utility markets
The index is based on prices collected from participating cities and metropolitan areas rather than a single nationwide household bill. MERIC explains that its cost-of-living indexes are derived by averaging participating locations within each state.
Hawaii vs. Idaho: A Huge Difference
The difference between Hawaii and Idaho is especially striking.
Hawaii has an index of 183.5, while Idaho has an index of 73.4.
That is a difference of 110.1 index points.
Put another way, Hawaii’s index is about 2.5 times Idaho’s.
This demonstrates how dramatically utility expenses can vary depending on where someone lives.
Complete Utility Cost Rankings
Here are the remaining state figures shown in the Q1 2026 comparison:
| State | Index | State | Index |
|---|---|---|---|
| Alabama | 96.9 | Alaska | 148.4 |
| Arizona | 102.1 | Arkansas | 98.3 |
| California | 134.6 | Colorado | 88.7 |
| Connecticut | 126.5 | Delaware | 97.5 |
| Florida | 94.6 | Georgia | 98.6 |
| Hawaii | 183.5 | Idaho | 73.4 |
| Illinois | 102.6 | Indiana | 95.2 |
| Iowa | 88.6 | Kansas | 97.4 |
| Kentucky | 87.8 | Louisiana | 82.3 |
| Maine | 124.6 | Maryland | 113.2 |
| Massachusetts | 143.9 | Michigan | 98.0 |
| Minnesota | 95.4 | Mississippi | 94.4 |
| Missouri | 92.4 | Montana | 80.2 |
| Nebraska | 92.1 | Nevada | 81.3 |
| New Hampshire | 116.4 | New Jersey | 110.3 |
| New Mexico | 80.0 | New York | 102.2 |
| North Carolina | 94.3 | North Dakota | 86.4 |
| Ohio | 100.9 | Oklahoma | 94.5 |
| Oregon | 96.3 | Pennsylvania | 108.4 |
| Rhode Island | 122.3 | South Carolina | 95.1 |
| South Dakota | 85.4 | Tennessee | 84.5 |
| Texas | 104.0 | Utah | 84.4 |
| Vermont | 112.0 | Virginia | 99.5 |
| Washington | 99.4 | West Virginia | 90.4 |
| Wisconsin | 96.0 | Wyoming | 92.4 |
Washington, D.C. is also included in the map with an index of 107.8.
What This Means for the Cost of Living
Utility bills are only one part of household expenses. Housing, transportation, healthcare, groceries and taxes can have an even bigger effect on the total cost of living.
Still, utility costs matter because they are recurring expenses. Someone comparing different states should consider the utility index alongside other cost-of-living measures.
The Q1 2026 data shows a clear regional pattern: Hawaii, Alaska, California and New England have some of the highest utility costs, while several Western and Southern states have much lower indexes.
Final Takeaway
The utility costs by state rankings reveal a much larger gap than many people might expect.
Hawaii ranks first at 183.5, followed by Alaska at 148.4 and Massachusetts at 143.9. At the other end, Idaho ranks lowest at 73.4, followed by New Mexico, Montana and Nevada.
For people deciding where to live, work or retire, utility prices are worth considering alongside housing and other everyday expenses.
Frequently Asked Questions
What state has the highest utility costs?
Hawaii has the highest utility cost index, with a Q1 2026 score of 183.5, or 83.5% above the U.S. average.
What state has the lowest utility costs?
Idaho has the lowest utility cost index, with a score of 73.4, which is 26.6% below the national average.
What is the U.S. average utility cost index?
The U.S. average is set at 100. States below 100 have lower utility costs than the national benchmark, while states above 100 have higher costs.
Why are utilities so expensive in Hawaii?
Hawaii relies heavily on imported fuel for electricity generation. The transportation of fuel to the islands contributes to higher energy costs.
Which states have the cheapest utilities?
The lowest-ranked states in the Q1 2026 comparison include Idaho, New Mexico, Montana, Nevada and Louisiana.
Are utility costs the same as total cost of living?
No. Utility costs are only one part of the cost of living. Housing, groceries, transportation, healthcare and other expenses are measured separately.
What does a utility cost index of 120 mean?
An index of 120 means utility prices are approximately 20% above the U.S. benchmark of 100.
Does the utility index represent an actual monthly bill?
No. It is a relative price index, not a prediction of what every household will pay each month. Actual bills depend on usage, home size, local rates, weather and other factors.