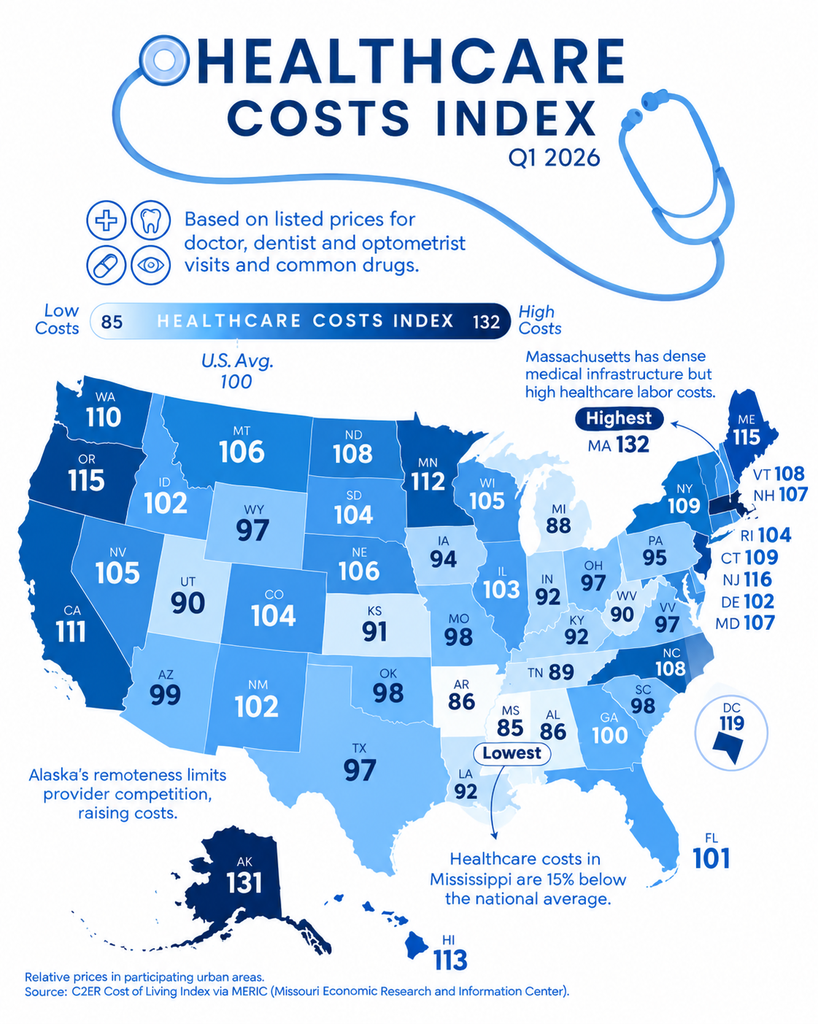
Healthcare can look affordable on paper until a doctor’s visit, prescription, dental checkup, or routine eye exam lands on the bill. In 2026, those everyday expenses vary sharply across America. The healthcare costs index offers a useful way to compare these differences without reducing the entire picture to one dollar amount.
The Q1 2026 data shown in the accompanying visualization uses prices for doctor, dentist, and optometrist visits along with common prescription drugs. The national benchmark equals 100, meaning a state above 100 has higher listed healthcare prices than the benchmark. The data comes from MERIC through the C2ER Cost of Living Index.
What the Healthcare Costs Index Measures
The number 100 is the key to reading this map. A score above 100 indicates relatively higher healthcare prices while a score below 100 indicates relatively lower prices. For example, a state scoring 115 sits roughly 15% above the benchmark for the measured healthcare basket. However, this index measures prices rather than every household’s actual medical spending.
State Healthcare Cost Index Position
Massachusetts 132 Highest
Alaska 131 Very high
Oregon 115 High
Maine 115 High
California 111 High
Washington 111 High
New York 109 Above average
Mississippi 85 Lowest
Alabama 86 Very low
Arkansas 86 Very low
That distinction matters because healthcare prices aren’t the same as healthcare spending. A household’s final bill can depend on insurance coverage, income, medical needs, deductibles, prescriptions, and how frequently someone uses medical services. The Health Care Cost Institute similarly emphasizes that spending, prices, utilization, and income all shape healthcare affordability.
The underlying C2ER methodology uses a standardized basket of consumer prices across several categories. MERIC explains that its state indexes come from participating cities and metropolitan areas while C2ER coordinates the broader collection framework. The healthcare component therefore provides a comparative price measure, rather than promising that every resident will pay the same amount.
States With the Highest Healthcare Costs in 2026
Massachusetts sits at the top of the Q1 2026 healthcare ranking. Its index reaches approximately 132 in the visualization which places it around one-third above the national benchmark. Alaska follows closely at 131 while Oregon and Maine each record about 115. These figures reveal a striking geographic divide across the American healthcare market.
Massachusetts’ position becomes even more interesting when the wider cost-of-living picture enters the conversation. MERIC’s latest data continues to place Massachusetts among America’s most expensive states overall. In Q2 2026, its composite cost-of-living index reached 148.1 while its health component stood at 129.7.
Alaska presents a different kind of challenge. Its remoteness can limit provider competition and increase the logistical cost of delivering medical services across enormous distances. The state’s Q2 2026 MERIC health index reached 130.6 while its overall cost-of-living index stood at 124.5.
Oregon and Maine also sit well above the national benchmark in the visualization. Their relatively elevated healthcare prices form part of a broader regional pattern. Eight of the ten highest-cost states in the Q1 comparison were located in either the Northeast or West according to reporting based on the 2026 dataset.
Why Are Healthcare Prices Higher in Some States?
Several forces can push healthcare prices upward at the same time. Labor expenses, provider availability, facility costs, insurance markets, local competition, and geographic isolation can all influence what consumers ultimately face. A state with expensive housing and higher wages may also carry greater operating costs for hospitals and medical practices.
Alaska demonstrates how geography can complicate the equation. Massachusetts illustrates another pattern where dense medical infrastructure coexists with expensive labor and operating expenses. These examples show why simply labeling a state “expensive” doesn’t explain the entire story.
States With the Lowest Healthcare Costs in 2026
Mississippi stands at the opposite end of the Q1 2026 comparison. Its index sits around 85 which places measured healthcare prices roughly 15% below the national benchmark. Alabama and Arkansas also remain near the bottom with scores in the mid-80s.
The latest MERIC figures reinforce that pattern. In Q2 2026, Mississippi recorded a health index of 84.8 while Alabama reached 85.2 and Arkansas reached 85.5. Those figures remain substantially below the U.S. benchmark of 100.
Lower prices don’t automatically mean better healthcare affordability for every resident. Income changes the equation dramatically. A $100 medical service can feel manageable to a high-income household while becoming a serious burden for someone earning much less. The Health Care Cost Institute therefore argues that healthcare affordability should consider both spending and local income.
This distinction is especially important when comparing states such as Mississippi with wealthier regions. Lower medical prices can help households stretch their budgets. Yet lower wages, insurance coverage, transportation barriers, and access to specialists can still affect the real-world experience of getting care.
Healthcare Costs Compared Across America
The national map reveals a surprisingly wide spread between states. High-cost states cluster heavily around parts of the Northeast and West while several Southern and Midwestern states record lower healthcare price indexes. That geographic pattern becomes clearer when the numbers are arranged side by side.
Category Examples Approximate index
Highest Massachusetts 132
Very high Alaska 131
High Oregon, Maine 115
Above average California, Washington 110–111
Around average Many states 95–105
Low Arkansas, Alabama 86
Lowest Mississippi 85
California provides an interesting middle ground. Its healthcare index is elevated at roughly 111 in the visualization. Yet the state’s overall cost pressures extend far beyond medical services. MERIC’s Q2 2026 data places California’s overall cost-of-living index at 140.3 with housing reaching 192.1.
Meanwhile, states such as Utah demonstrate why healthcare should be examined separately from overall living expenses. Utah’s Q2 2026 health index was 90.4 while its overall cost-of-living index reached 98.4. In other words, a state can have healthcare prices below the national benchmark while its broader household expenses sit much closer to average.
What the Healthcare Costs Index Means for You
Choosing a state based solely on medical prices could lead to the wrong conclusion. If you’re relocating for work, studying, retiring, or raising a family, consider healthcare alongside housing, wages, insurance, transportation, taxes, and access to specialists. The cheapest medical price isn’t necessarily the cheapest overall lifestyle.
For example, imagine two workers earning different salaries in two states. One pays more for a doctor’s appointment but earns considerably more each month. Another pays less for the same appointment yet faces lower wages and higher transportation costs. The second option isn’t automatically more affordable.
Healthcare affordability is ultimately a household equation rather than a single ranking. The 2026 index provides an excellent starting point for comparing relative prices. Yet your insurance plan, income, medical needs, and location within a state can change the final calculation considerably.
The broader data also shows why national averages can hide important details. The Health Care Cost Institute’s 2026 Health Cost Landscape found substantial differences among metropolitan areas and states while emphasizing that income and healthcare spending together provide a better picture of affordability.
The biggest takeaway is simple: healthcare prices differ dramatically across America. Massachusetts and Alaska occupy the expensive end of the 2026 comparison while Mississippi, Alabama, and Arkansas sit near the affordable end. Still, the smartest comparison combines healthcare prices with income, insurance, housing, and access to quality medical services.